quaeler.github.io
Using Sleak in KNIME
Sleak allows you to do a state comparison in KNIME (or any other Eclipse RCP-based application) to monitor usage of SWT resources. The methodology is:
- install Sleak in KNIME
- configure KNIME to allow debugging inspection on certain SWT facets
- run KNIME in debug mode
- open the Sleak view in KNIME
- take a ‘snapshot’ in Sleak (this marks the “A” of an A-B comparison)
- do some stuff in KNIME
- click the Sleak ‘Diff’ button to mark the “B” point and show the SWT resource difference
- inspect the differences to look for something suspect
Install Sleak in KNIME
Sleak can be installed from the Eclipse download site; from your KNIME, select Help → Install New Software… and in the panel that comes up, choose “The Eclipse Project repository” from the pulldown. If you don’t see that in your pulldown, you can type in the URL http://download.eclipse.org/eclipse/updates/4.7 yourself and hit return. Once KNIME has gotten the list of available installations from the remote site and populated the table below, you can type “Sleak” into the top box which will present you with the install item of SWT Tools. This can be seen in this screenshot:
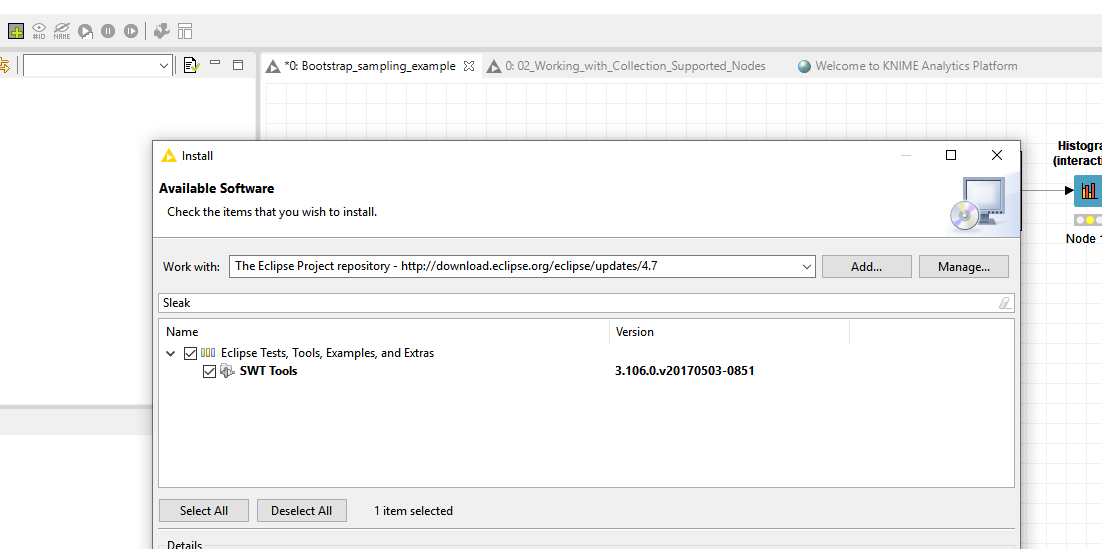
If you don’t see SWT Tools, uncheck the panels ‘Hide already installed items’ checkbox to see if you already have it installed for some reason.
Finish the installation, restarting KNIME as required; once KNIME has restarted, quit it.
Configuring KNIME
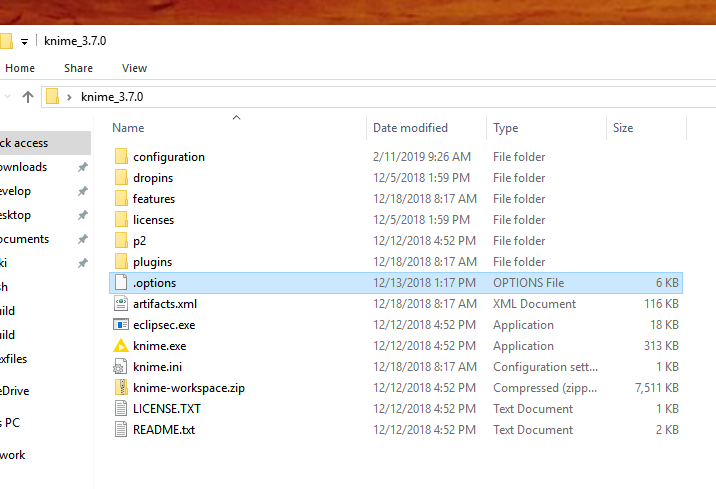
KNIME needs to be told to turn on some SWT monitoring which is normally not turned on; this can be done by specifying an options file, an appropriately configured one can be downloaded here. This file must be renamed from options to .options (which will turn it invisibile to your Finder if you are doing this on macOS.)
You must copy this file to the same directory which houses your knime.exe
Running KNIME
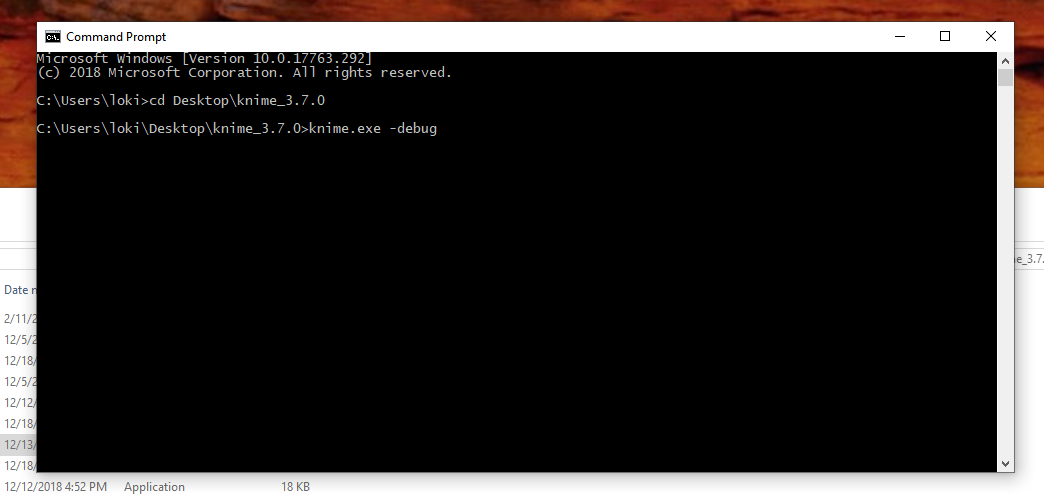
Open a CMD window and change directories into the directory which has your knime.exe From here, type knime.exe -debug - all of which is reflected in this screenshot:
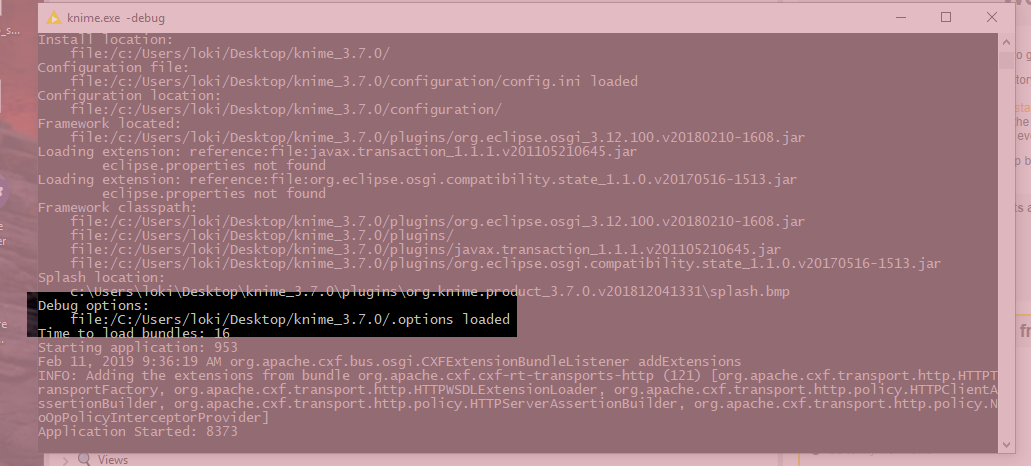
Once you hit enter, a second terminal window will open into which KNIME is dumping some startup logging information; once KNIME has finished launching, verify in this terminal window that it loaded your options file, as can be seen in this screenshot:
Opening Sleak
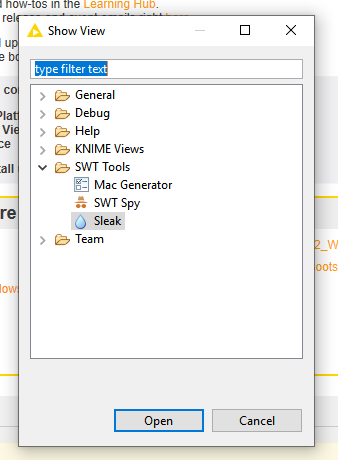
Now the KNIME is up, chose View → Other… and navigate to Sleak, as is seen in the below screenshot, and select it to open it.
Using Sleak
Now that we have your KNIME set-up to use Sleak, open a troublesome workflow. Once it is open, click the “Snapshot” button in the Sleak view; this will produce something similar to what is seen in this screenshot:
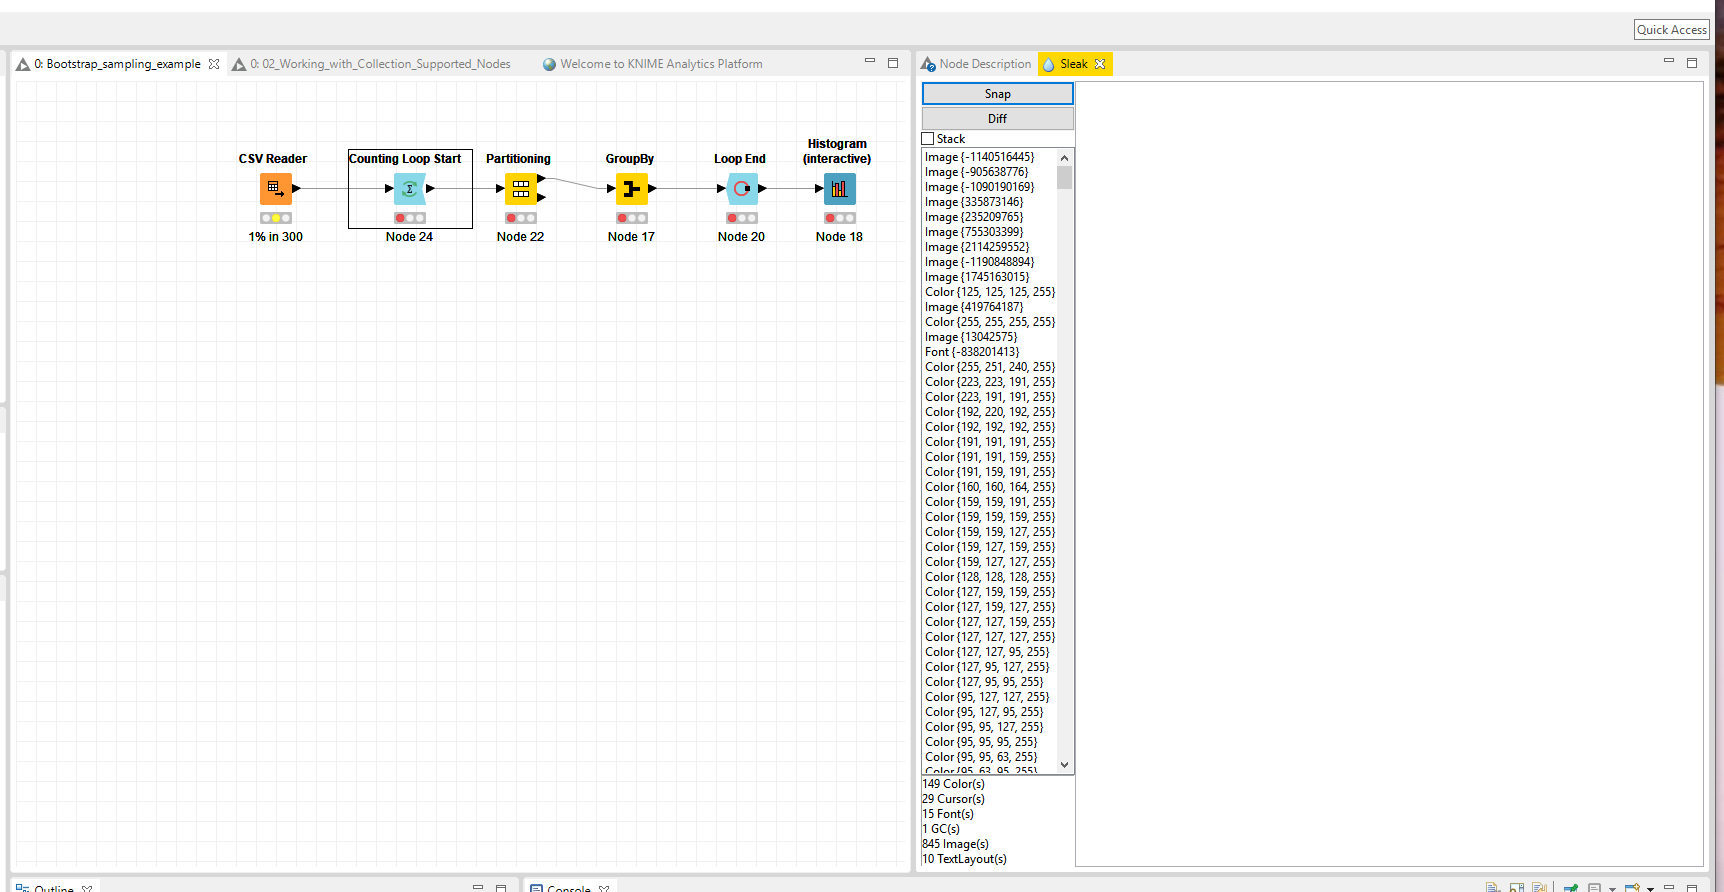
What this has done is record a starting state of SWT resource consumption which we will later compare to a subsequent state. You can click this “Snapshot” button to set a new base comparison state whenever you want.
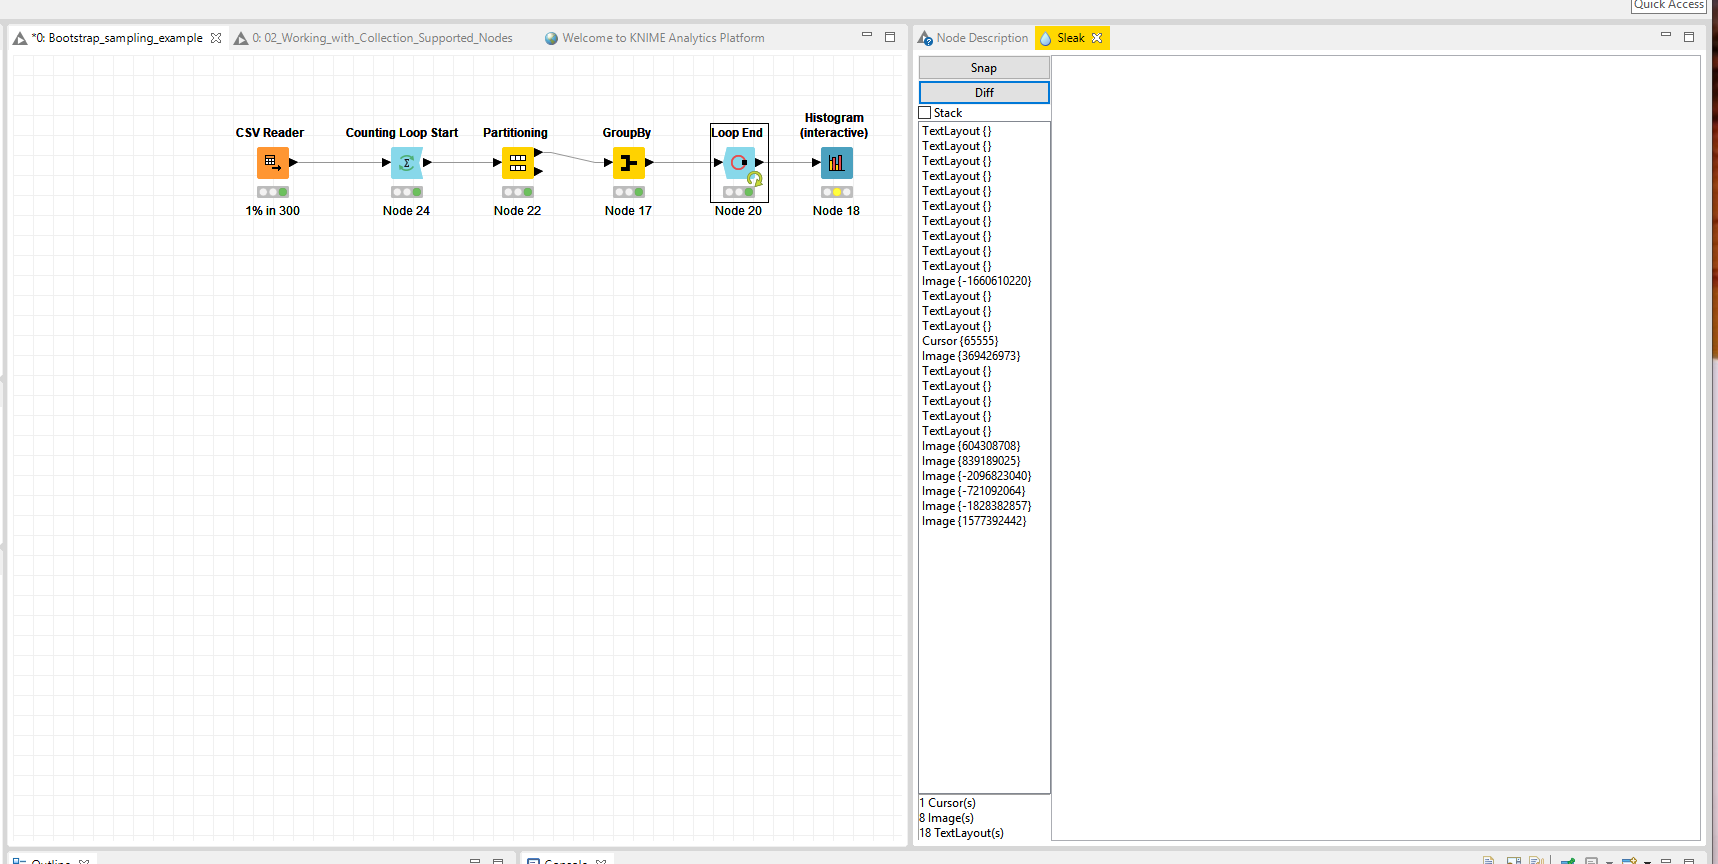
Now do some execution, node configuration, whatever in KNIME - something that you suspect is being unkind with SWT resources; now, click the “Diff” button in the Sleak view.
What this has done is to record a second state and compared it to the base state, listing for you the resources that have been created, and are still held on to by KNIME; an example of a comparison, demonstrating the resource difference before and after the shown workflow loop has been executed, can be seen here:
Finding the Suspicious
So… what are we looking for? Well, avoiding technical minutia of what we decide to cache and what we don’t (caching means that we will hold on to a created SWT resource for longer than its single usage (for example, keeping a newly created color so that it can be shared in the future across the application instead of creating it again and again)), we expect to see Color, Cursor, Font and TextLayout creation pretty regularly as the application runs - and these are not grave resource drains. What we don’t expect to see, and we look for as something needing to be investigated, is GC creations in the 10-or-greater range and Image creation in the 100-or-greater(*) range.
Of note on the Images, the creation count is directly related to the number of nodes one has in their workflow, and that number increases during the first execution cycle of the node. So, then, a better indication of suspicious behavior would be:
if you are seeing greater than ~6 Image instances per node executed, especially if you see this on executions of the node subsequent to the first succesful execution, then this is note worthy and should be reported.